Software
Data Visualization Interactive
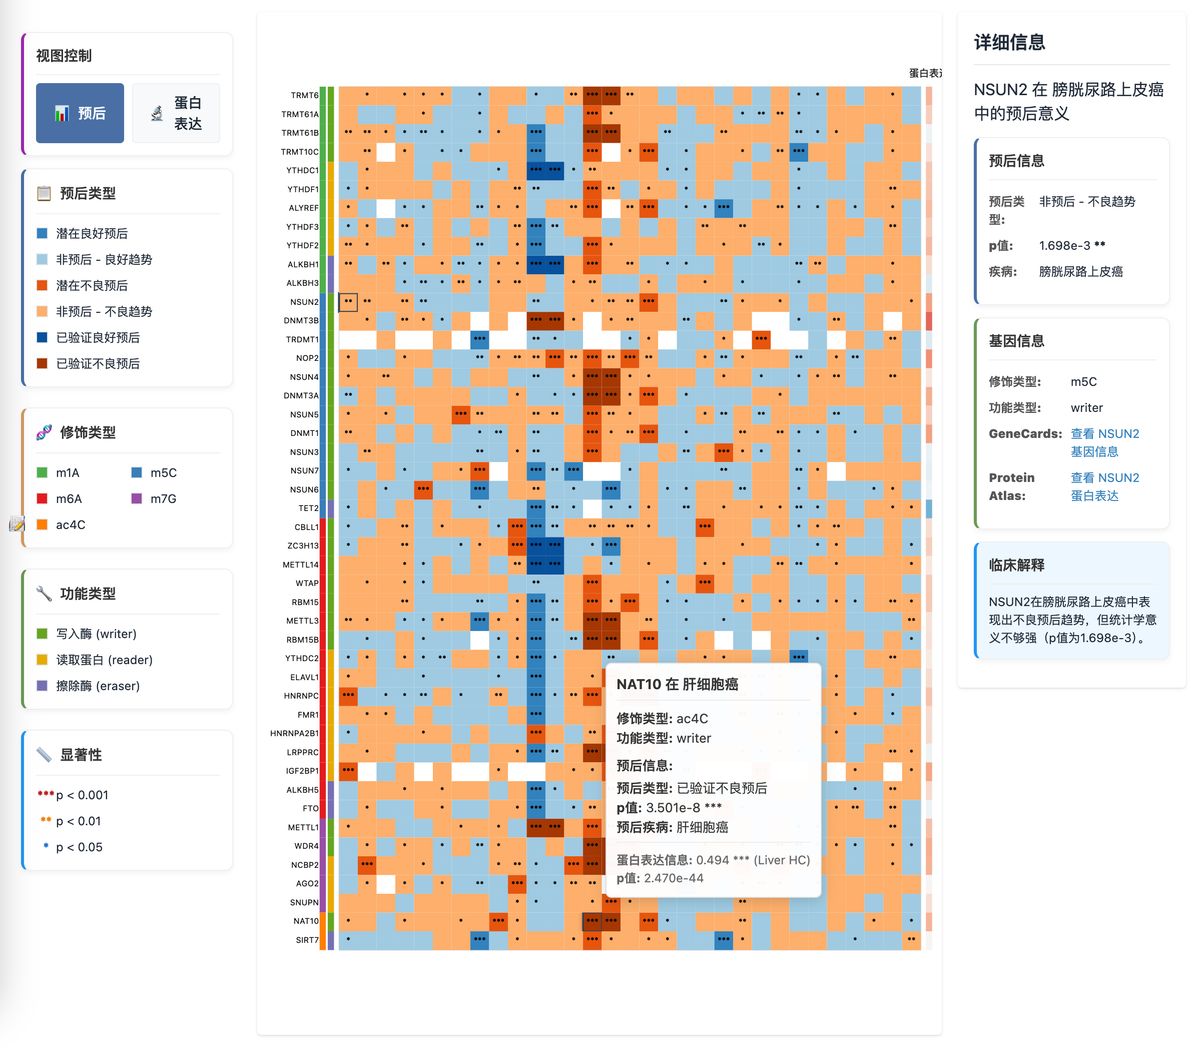
Interactive RNA Methylation Heatmaps
This tool visualizes RNA methylation data from The Human Protein Atlas, featuring two key components: protein expression heatmaps showing differential expression between cancer and normal tissues (CPTAC MS data), and prognostic heatmaps displaying survival correlations across 21 TCGA cancer types. Users can explore relationships between methylation patterns (m1A, m5C, m6A, m7G, ac4C), functional roles (writer, reader, eraser), and clinical outcomes through an interactive interface with statistical significance indicators.
Visit Project s
Last updated: May 2025